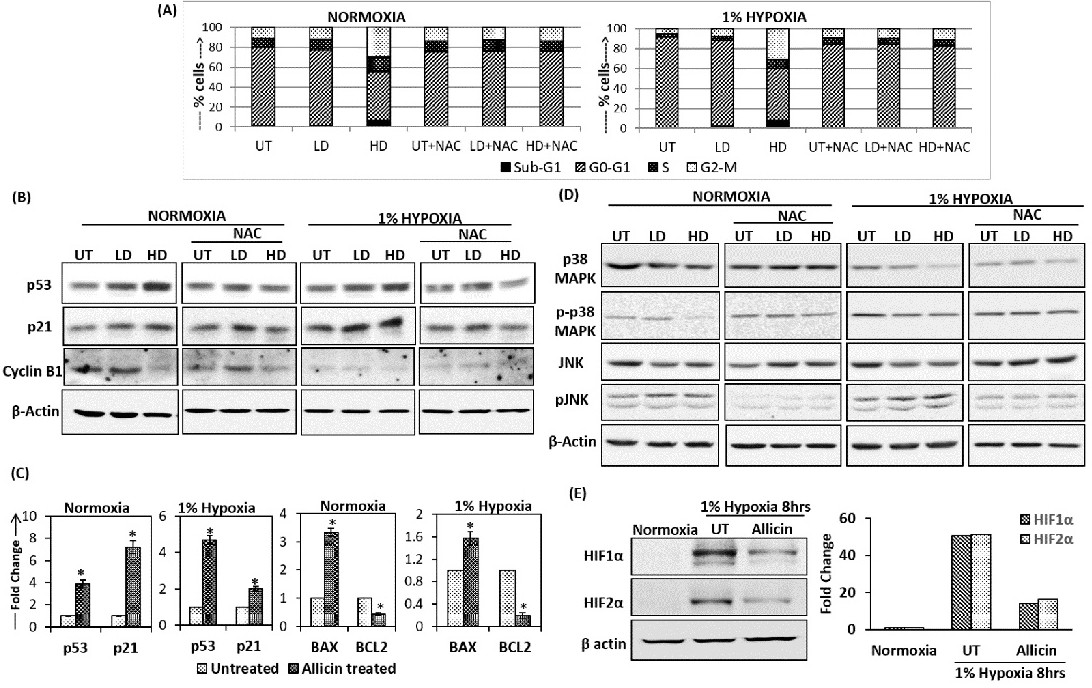
Fig. 5. Involvement of p53, p21 and MAPK signaling cascades in allicin mediated cell cycle arrest and cell death process in A549 cells. (A) Graph representing percentage of A549 cells present in different stages of cell cycle after treatment with allicin in absence and presence of antioxidant NAC for 48hr in normoxic and hypoxic condition as determined by flow cytometry. (B) Immunoblot analysis of p53, p21 and cyclin-B1in A549 cells treated with allicin in absence and presence of antioxidant NAC and cultured in normoxia and 1% hypoxia for 48hr. (C) mRNA quantification of p53, p21, BAX and BCL2 by real-time PCR in untreated and 40μg/ml allicin treated A549 cells cultured in normoxia and 1% hypoxia. Results indicate fold change relative to untreated cells after normalization to the 18s expression. The bars represent the mean ± standard deviation calculated from three independent experimental values. * represents p<0.05 compared to untreated cells. (D) Western blot analysis of p38 MAPK, phosphorylated p38 MAPK (p-p38 MAPK), JNK and phosphorylated JNK (pJNK)in A549 cells treated with allicin in absence and presence of antioxidant NAC and cultured in normoxia and 1% hypoxia for 48hr. (E) Representative western blot analysis and corresponding graph depicting fold change in IDV of HIF-1α and HIF-2α in A549 cells treated with 40μg/ml allicin and cultured in 1% hypoxia for 8hr. UT= untreated, LD=10μg/ml allicin and HD=40μg/ml allicin.